The planning tools
What each tool is for and how to use it well.
Market research
Business model canvas: nine boxes describing your business; it saves as you type. Market size: your total market, the share you can target and the share you can reach. Personas: the people you serve. Competitors: who else solves the problem. Discovery log: notes from customer conversations, including what you learned was true or false.
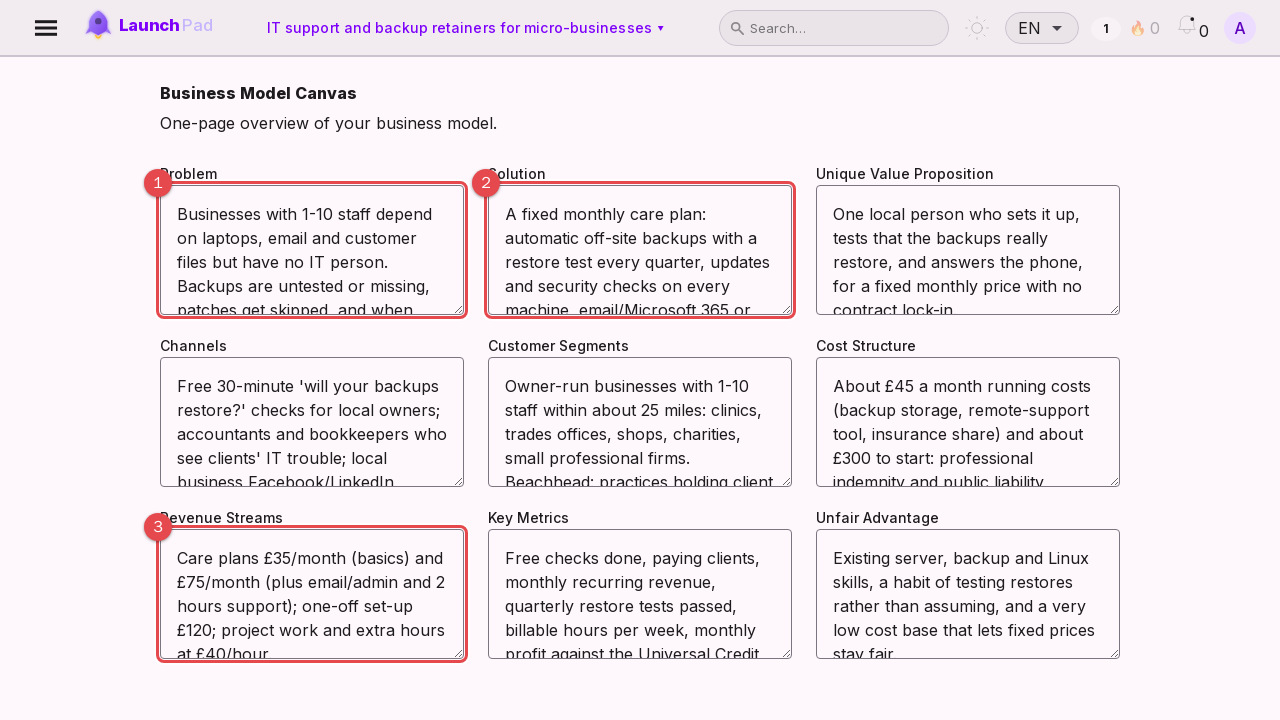
Problem: what hurts for your customer.
Solution: how you fix it.
Revenue streams: how money comes in.
Financials
Pricing: your price, target monthly income and expected growth. Unit economics: what a customer costs to win (CAC), what they pay (ARPU), how many leave (churn) and your costs; it shows whether each customer is worth winning. Burn rate: monthly spending and cash in the bank. Kill criteria: the lines that tell you to stop or change course, decided in advance. Hypotheses: assumptions you will test.
All money amounts are in pounds unless a label says otherwise.
Decisions and scoping
Decisions records what you chose, the options you considered and why, so you can learn from it later. Scoping scores features by Impact, Confidence and Ease (1 to 10) and multiplies them into a score so you can decide what goes into the first version.
OKRs, KPIs and PDCA
OKRs: an objective for a quarter with measurable key results; update their values as you go. KPIs: numbers you track with a target; use Update value to record progress and the status shows whether you are on track. PDCA: a plan-do-check-act cycle for one improvement at a time; complete each phase in order.
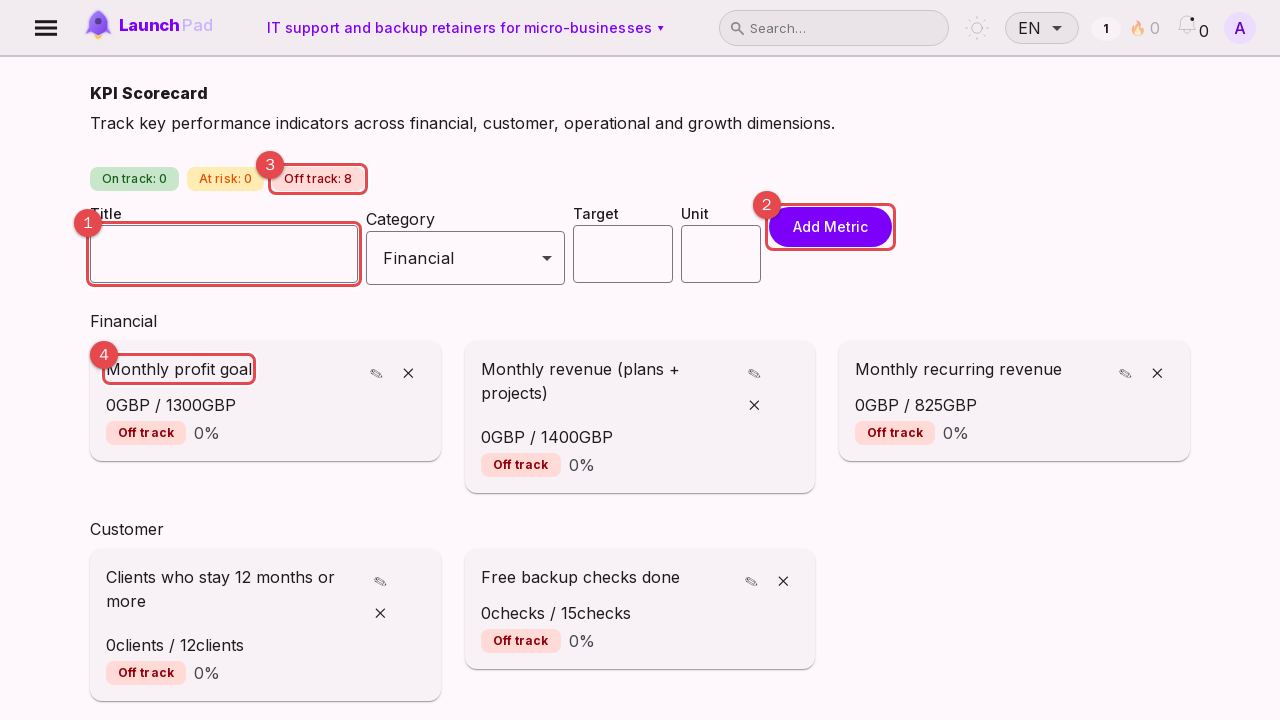
Title: name of the number you want to track.
Add Metric: saves it to the scorecard.
Status counts: on track, at risk and off track.
A metric card: current value against target.
Hoshin
The Hoshin pages link long-term objectives to the companies and partners that help you reach them, and the bowling chart tracks a result month by month.
Risks
Rate each risk by probability and impact (1 to 5); the score is probability times impact. Write a mitigation and an owner, and set the status as you deal with it.
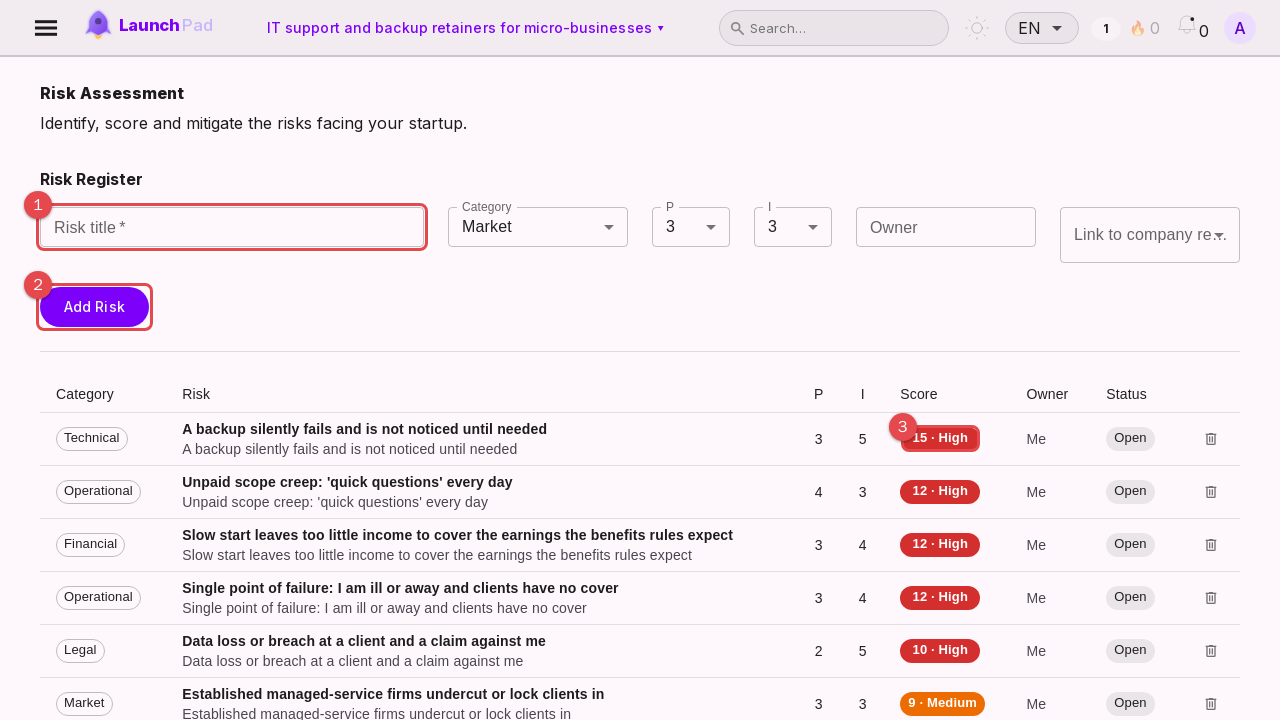
Risk title: describe what could go wrong.
Add Risk: adds it to the register.
Score: probability times impact; high scores come first to fix.
Pivots
Record when and why you changed direction, so you remember what you learned.
Weekly review
Once a week, note your wins, challenges, next goals and morale. It takes five minutes and builds a record you can look back on. You can save one review per week and edit it that week.
Companies and accelerators
Keep track of competitors, customers, partners, investors and programmes you might apply to. Startup compare lets you compare companies on investment, weeks to bootstrap and monthly revenue.